-
Title
-
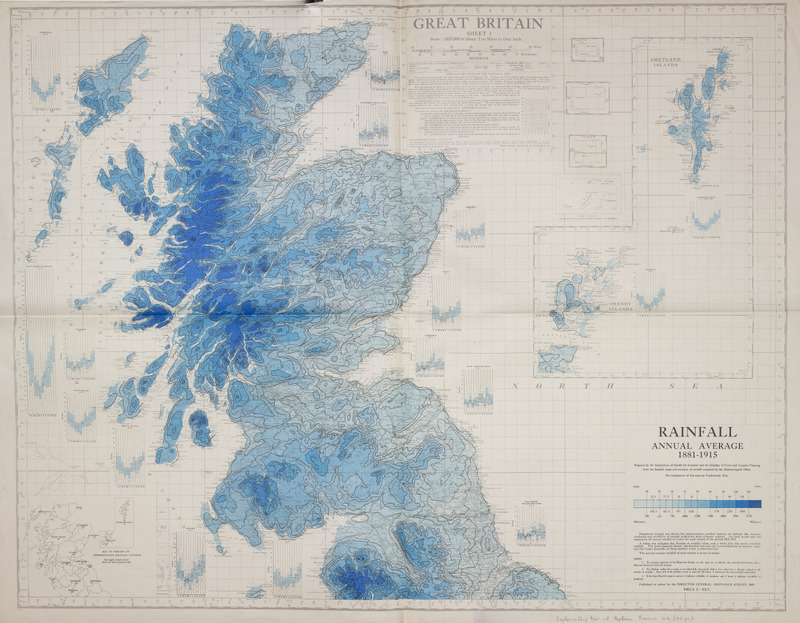
The physical atlas: a series of maps & notes illustrating the geographical distribution of natural phenomena
-
Description
-
This world map charts the distribution of average temperatures on the Earth’s surface using isothermal lines. Isothermal lines were first proposed by the German naturalist and climatologist, Alexander von Humboldt (1769-1859), and started being used as visual aids by cartographers around the mid-19th century. The explanatory notes accompanying the map state that isothermal lines help illustrate the influence of different temperatures “on vegetation, agriculture, the ripening of fruits, and the material well-being of Man.” Cartographic depictions of the weather merge scientific data with geography assisting in understanding the world’s climate at scale.
-
Creator
-
Alexander Keith Johnston;Heinrich Karl Wilhelm Berghaus;David Brewster;W. & A.K. Johnston Limited
-
Date
-
1848
-
Identifier
-
Extra large folioL13 Joh

 A Thousand Words for Weather